Python
End to end Machine learning, predictive modeling
Production-ready code
R
Perfect for statistics
Visualization
Shiny
Quick and easy
MATLAB
Data Engineering
34000+ Lines of code

Salary Prediction
Predict salary based on job description. Linear regression, Random Forest and Gradient Boost. (Source: datasciencedreamjob.com)

Spam Filter
Use Bayesian Statistics and Logistic Regression to calculate the probabilities of each text message being a spam. (Source: dataquest.io)
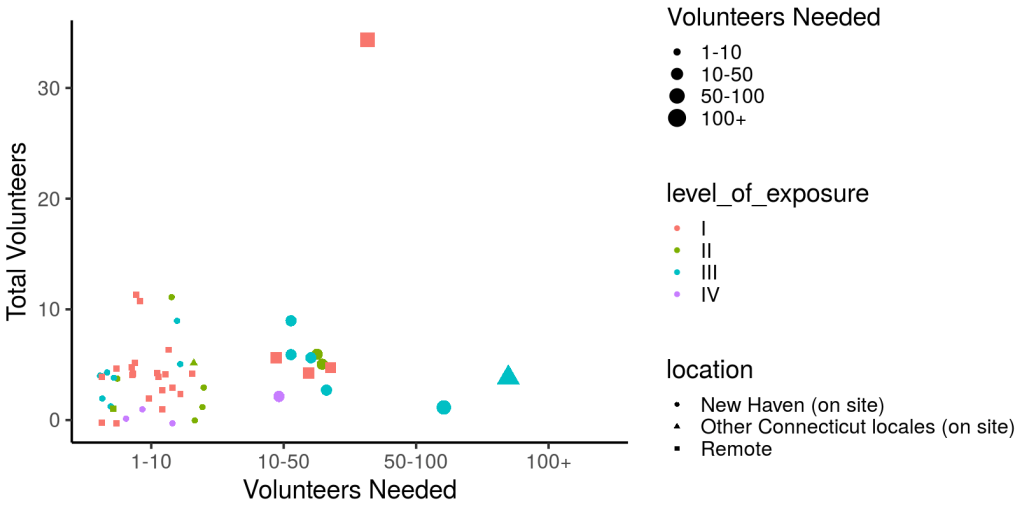
newhavenhelpwithcovid.com visualization
newhavenhelpwithcovid.com is a platform for volunteer organization. This visualization using R and Shiny shows the site participation and projects categories. (Source: newhavenhelpwithcovid.com)

Pipeline for High-density EEG data processing
A library that I am continuously adding and refining in the last decade to facilitate data processing for high-density EEG. (Data Source: Developmental Electrophysiology Laboratory at Yale Child Study Center

Titanic Survival
Predict Titanic survival. Logistic Regression, K-nearest Neighbor, Decision Tree, Random Forest, Support Vector Classification (SVC), XGBoost) with cross-validation, Grid and Random search (Source: Kaggle.com)

Housing Price Prediction
Use Linear Regressions to predict the condominium price in New York City across different boroughs. Using gross square feet as the predictor. (Source: dataquest.io)

Covid19 US
This visualization using R and Shiny plots the number of confirmed case and deaths for each state by time. (Source: NYTimes Covid 19 data on github)
